

 15 min Read
| Library Name | GitHub Stars | NPM Downloads | Rendering | Backed by |
|---|---|---|---|---|
| React Chartjs-2 | 6.2K+ | 1.1M+ | Canvas | Open-Source Community |
| Recharts | 21.6K | 1.2M+ | SVG | Open-Source Community |
| React-vis | 6.8K+ | 157K+ | SVG, Canvas | Uber |
| Nivo | 12.3K+ | 6K+ | SVG, Canvas | Open-Source Community |
| React-Google-Charts | 1.5K+ | 138K+ | SVG | Open-Source Community |
| React D3 Library | 2.4M+ | 1.7M+ | SVG | d3js.org |
| Visx | 18.2K+ | 23.8K+ | SVG | Airbnb |
| react-financial-charts | 1K+ | 2.8K+ | SVG | Open-Source Community |
| react-stock charts | 3.8K+ | 22K+ | SVG | Open-Source Community |
| react-time-series-charts | 842+ | 12K+ | SVG | ESnet |
Charts are crucial for visually conveying information and are widely used in all sectors and domains. It simplifies the complex data and makes it easier for individuals to understand and interpret information through visual representation. Charts are useful in data analysis and are also useful for comparing complex data in a visual format, for effective decision making.
Why use React chart libraries?
Charts are extremely valuable and powerful tools for complex data analysis and comparing complex data sets. Charts make it easy to understand and remember data and the behavior of the data. But in the same way, it’s highly complicated to prepare charts on the website by using pure HTML and JavaScript. To resolve this issue, react chart library comes into play. By utilizing the react chart library, we can use well-developed and thoroughly tested source code in our project to create any chart with very little effort.
Each library comes with its unique features and functionality. Most react chart libraries are open-source and freely available to everyone. You can check and quickly verify their popularity based on GitHub stars and the number of weekly npm downloads as mentioned in the below table.
Top 11 trending React chart libraries of 2025
1. Chart.js (React Chartjs-2)
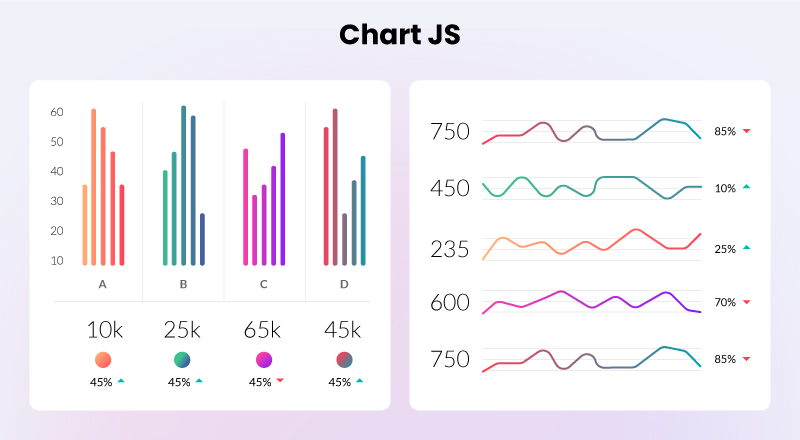
Easy integration with React applications, it supports a variety of devices to make designs responsive. It provides a wide range of charts, including line charts, bar charts, radar charts, doughnut charts, and many more, to fulfill any requirement. It supports dynamic data binding, allowing charts to update in real-time and showcase live data updates.
React chartjs-2 is developed for React, if you are using it in React applications you experience no learning curve to implement this library.
react-charts-2 is a rewrite built on top of the popular JavaScript library, Chart.js. So, you will find many common features.
- Website: React Chartjs-2
- Star: 6.2K+
- No SVG support
- canvas support
- NPM Downloads: 1.1M+
- Backed by Open-Source Community
- npm, yarn, pnpm
2. Recharts:
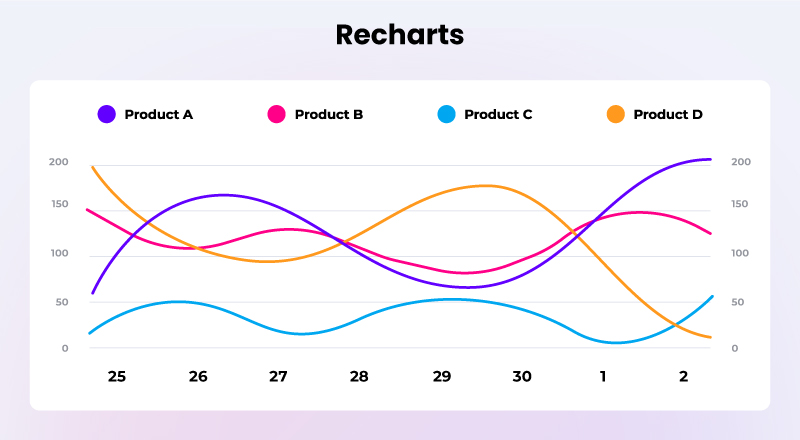
Recharts is specifically developed for React with the support of a component-based architecture. It makes it easy for React developers to integrate stunning charts without any specific learning curve.
Recharts provides individual components, a powerful API, and a responsive design. It also provides built-in animation and interaction support.
- Website: Rechart
- Star: 21.6K
- SVG support
- No canvas supports
- NPM Downloads: 1.2M+
- Backed by Open-Source Community
- npm, yarn
3. Victory:

Victory is also one of the popular libraries for data visualization, developed in React on top of D3.js.
One of the major advantages of Victory is its support for building iOS and Android applications through its React Native library.
Victory provides very detailed documentation and highly active support for the library.
- Website: Victory
- Star: 10.6K+
- SVG support
- No canvas supports
- NPM Downloads: 237K+
- Backed by Formidable
- npm, yarn
4. React-vis:
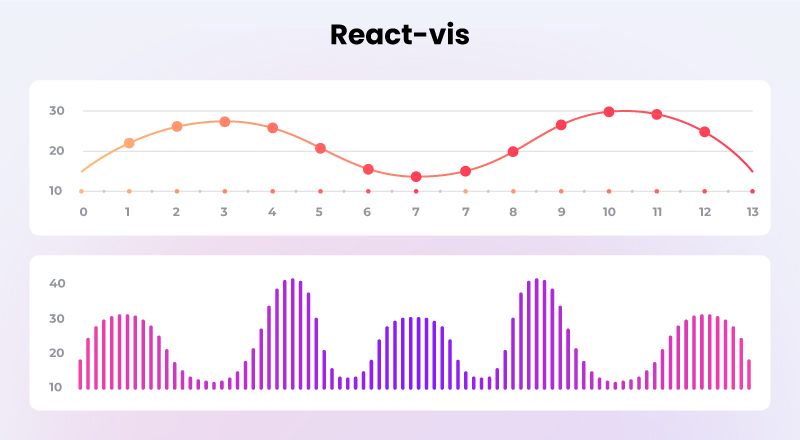
React vis library is a data visualization library developed by Uber Open Source. It is very easy to implement this library so anyone can adapt it to generate charts.
Most of all common charts are available in React Vis. e.g., Arc, Area, Bar, line, Heatmap, Hexabin, etc.
Detailed documents and active community support are available.
- Website: React Vis
- Star: 6.8K+
- SVG support
- Canvas support
- NPM Downloads: 157K+
- Backed by Uber
- Npm, yarn
5. Nivo:

Nivo is also developed in React and D3 and provides a wide range of charts. Nivo chart library supports SVG, Canvas, and HTML to generate charts. React server-side rendering also works well with this library.
Nivo offers multiple chart options with easy customization features. Most importantly, all the charts are responsive by default, easily aligning to any display size.
- Website: Nivo
- Star: 12.3K+
- SVG support
- Canvas support
- HTML support
- NPM Downloads: 6K+
- Backed by Open-Source Community
- npm, yarn
6. React-Google-Charts:
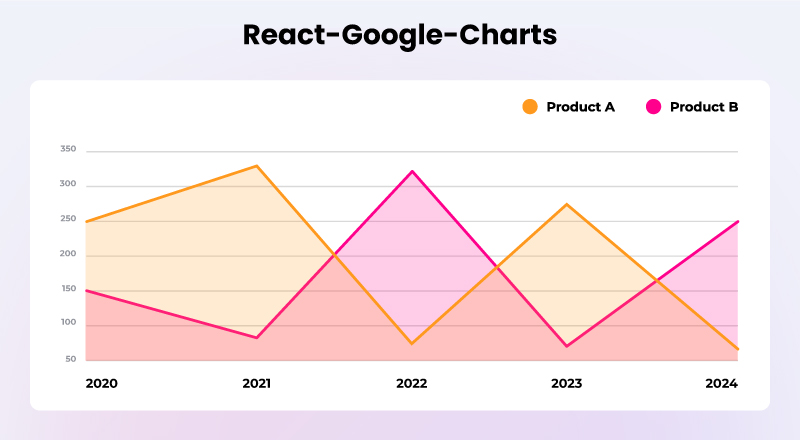
react-google-charts is a wrapper or bridge between a React component and Google Charts. It allows developers to provide React-friendly syntax for dynamic and interactive charts in their React applications. If you need a simple line chart, a formal scatter plot chart, or a fully dynamic organizational chart, react-google-charts provides a wide range of options. This flexibility allows developers to choose the right charts for their React applications.
react-google-charts also supports responsive design, making it suitable for all major screen sizes. react-google-charts can handle dynamic data, and interactive charts with real-time data. One of the major advantages of react-google-charts is it can easily integrate with other Google services.
- Website: React Google Charts
- Star: 1.5K+
- SVG support
- No canvas supports
- HTML support
- NPM Downloads: 138K+
- Backed by Open-Source Community
- npm, yarn
7. React D3 Library:
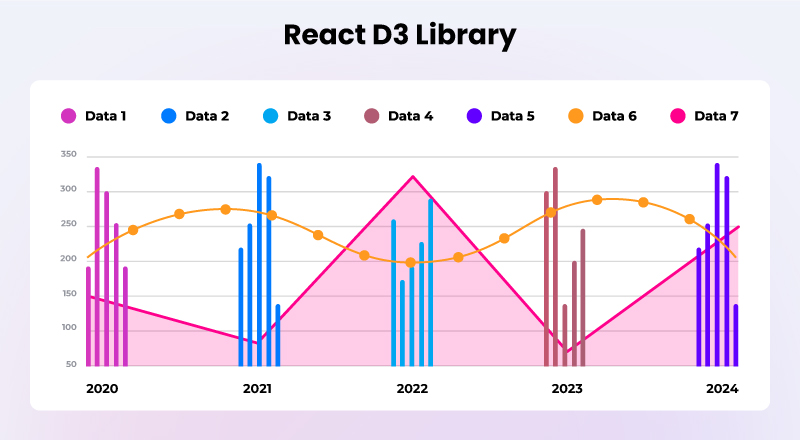
D3.js is an open-source JavaScript/npm library available for data visualization. In other words, D3 is a DData-DrivenDocuments library prepared as a JavaScript tool for binding data with HTML and SVG elements. According to D3.js documentation, ‘D3 is not a charting library in the traditional sense. It has no concept of “charts.” When you visualize data with D3, you compose a variety of primitives.’
D3 provides endless customization and flexibility. Developers have full control to choose specific features of the library based on chart needs. The D3.js library can handle a large amount of data very effectively and update the Document Object Model (DOM) according to the latest data changes.
From a very basic line chart to a highly complex graph, one can prepare using D3.js and its wide range of features. D3.js is available with comprehensive documentation and highly active community support.
- Website: React D3 Library
- Star: 2.4M+
- SVG support
- No canvas supports
- HTML support
- NPM Downloads: 1.7M+
- Backed by d3js.org
- npm, yarn
8. Visx:

Visx is a data visualization library developed by Airbnb on top of the D3 chart library, specifically for React, Visx provides a wide range of charts. If you are familiar with React, you will find seamlessly integrating into React applications. Visx provides a flexible API to build your library according to your requirements. Moreover, Visx provides high performance, generates bundles of small sizes, and works very well with other CSS and JS.
- Website: Visx
- Star: 18.2K+
- SVG support
- No canvas supports
- NPM Downloads: 23.8K+
- Backed by Airbnb
- npm, yarn
9. react-financial-charts:

The react-financial-charts library is specifically prepared for showcasing financial data. React-financial-charts library offers charts like Scatter, Area, Line, Candlestick, OHLC, Heiken Ashi, Renko, Kagi, Point, and figure. react-financial-charts library also provides different chart indicators like EMA, SMA, WMA, TMA, Bollinger band SAR, MACD, RSI, ATR, and many other interactive indicators.
react-financial-charts is created on top of react-stockcharts to convert it into Typescript from JavaScript.
- Website: React Financial Charts
- Star: 1K+
- SVG support
- No canvas supports
- NPM Downloads: 2.8K+
- Backed by Open-Source Community
- npm, yarn
10. react-stock charts:

The react-stock-charts library is specifically prepared for showcasing stocks and financial data. react-stock-charts library offers several types of charts like Scatter, Area, Line, Candlestick, OHLC, Heiken Ashi, Renko, Kagi, Point &and figure react-stock-charts library also provides different chart indicators like EMA, SMA, and WMA, TMA, Bollinger band, SAR, MACD, RSI, ATR, and many other interactive indicators.
- Website: React Stock Charts
- Star: 3.8K+
- SVG support
- No canvas supports
- NPM Downloads: 22K+
- Backed by Open-Source Community
- npm, yarn
11. react-time-series-charts:

The rreact-time-series-chartslibrary is built in React on top of D3, specifically designed to showcase time series and network traffic data. It also offers a zoom feature for users to focus on specific data points in the chart. react-time-series charts support various popular chart types, e.g., line charts, pie charts, bar charts, area charts, point charts, and scatter charts. The library comes with components for creating charts, making it easy to integrate into any project that uses a component-based approach
- Website: React Time Series Charts
- Star: 842+
- SVG support
- No canvas supports
- NPM Downloads: 12K+
- Backed by ESnet
- npm, yarn